

8 personal finance ratios that everyone should know

PHOTO: Unsplash
Just like how we can use financial ratios to analyse companies before investing in stocks, we can also use specific ratios to do a pulse check on our finances.
Here are eight important personal finance ratios that everyone should know about to identify potential financial pitfalls and help us make smarter financial decisions for the long term.
| Ratios | Definition | Formula | General acceptable range |
|---|---|---|---|
| Basic liquidity ratio | Indicates how robust a person's finances are to handle an emergency | Cash or cash equivalents / monthly expenses | Three to six months |
| Liquid assets to net worth ratio | Determines how much of an individual’s net worth is in the form of cash or cash equivalents | Cash or cash equivalents / net worth | At least 15 per cent |
| Savings ratio | Calculates the amount of income a person sets aside as savings | Monthly savings / monthly gross income | At least 20 per cent |
| Debt to asset ratio | Assesses whether a person’s debt level is high | Total liabilities / total assets | 50 per cent or less |
| Solvency ratio | Another method to find out about potential longer-term solvency issues | Total net worth / total assets | The higher, the better |
| Debt servicing ratio | Calculates the amount of net income that is used to make regular debt repayments | Total monthly debt repayments / monthly take-home income | 35 per cent or less |
| Non-mortgage debt servicing ratio | Similar to the previous one but excludes debt repayments for mortgage loans | Total monthly non-mortgage debt repayments / monthly take-home income | 15 per cent or less |
|
Net investment assets to net worth ratio |
Reveals how much of an individual’s assets are used to accumulate capital for the long-term, excluding the place of residence | Total invested assets / net worth | 50 per cent or more |

The basic liquidity ratio, also known as the emergency fund ratio, indicates how robust your finances are to handle an emergency such as job loss or unexpected expenses.
When an asset is liquid, it can be converted to cash quickly without losing value.
The basic liquidity ratio is calculated by comparing the cash (or near-cash) amounts to monthly expenses.
The higher the number, the more liquid the person's assets are.
The general guideline is three to six months of expenses should be in cash or near-cash to cover any emergency needs.
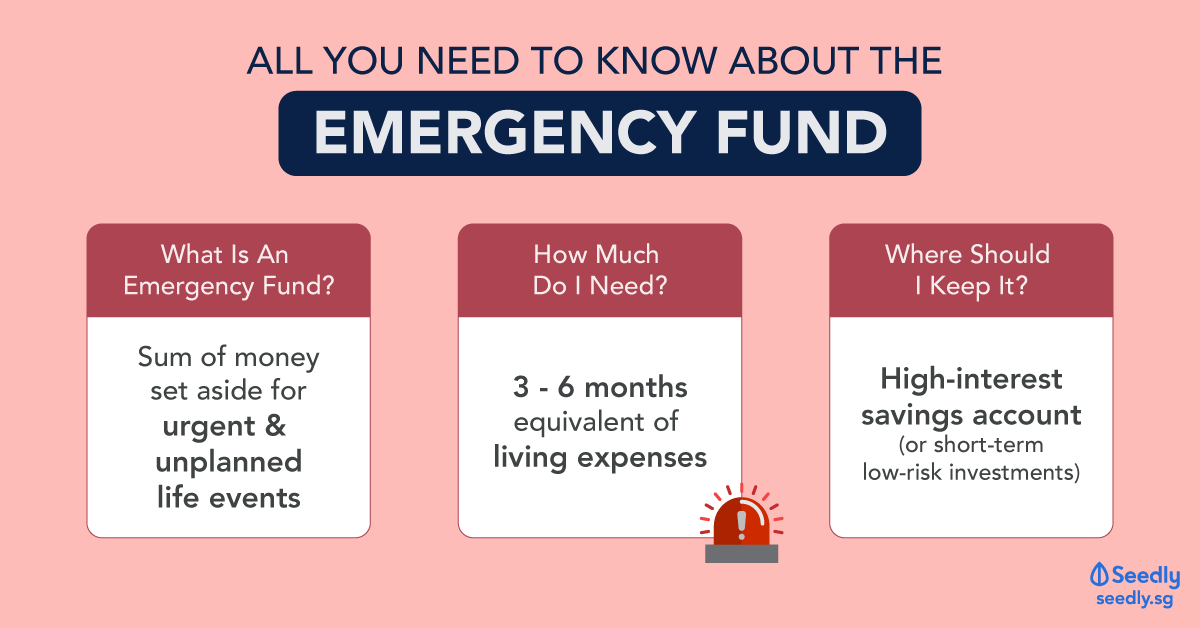
It may not be easy to convert one's assets into cash in an emergency situation, so it's essential to have some of the assets in liquid form.
The liquid assets to net worth ratio determine how much of an individual's net worth is in the form of cash or cash equivalents.
Net worth is simply the difference between the things you own versus what you owe.

Here's how to calculate the liquid assets to net worth ratio:
Generally, a minimum ratio of 15 per cent is safe.
The savings ratio calculates the amount of income a person sets aside as savings, which could be used to fulfil financial goals.
The formula behind the savings ratio is:
Gross income is what we receive before the mandatory CPF contribution.
In terms of savings, 20 per cent is healthy according to the 50-30-20 rule that you can follow as a general guideline:
The debt to asset ratio assesses whether a person's debt level is high.

Thus, it highlights the potential medium to longer-term solvency issues.
Solvency refers to the ability to pay one's debt as they come due.
The debt to asset ratio is calculated by comparing the total liabilities with the total assets.
In general, any figure of 50 per cent or less means that there are enough assets to cover the liabilities.
Another method to discover potential longer-term solvency issues is to use the solvency ratio.
This ratio reveals the probability of a person becoming insolvent or bankrupt.
The math behind the solvency ratio is:
The higher the ratio, the better it is , as this means that the person has a robust financial position.
The debt servicing ratio calculates the amount of net income that is used to make regular debt repayments.
Net income is known as "take-home" income, which is income after CPF contributions.
This is how we calculate the debt servicing ratio:
Usually, any ratio of 35 per cent or below shows there's enough income to pay for the monthly debt repayments.
The non-mortgage debt servicing ratio is similar to the previous one but excludes the debt repayments for a mortgage loan.
This ratio shows how much of a person's take-home income goes towards non-mortgage debt repayments.
Generally, a ratio of 15 per cent or below is considered safe.
Too high a ratio could mean that the person has borrowed excessively as most non-mortgage loans tend to be related to lifestyle expenses rather than long-term investments.
This ratio reveals how much of an individual's assets are used to accumulate capital for the long term, excluding the place of residence.

As retirement approaches for the person, the ratio should go higher since the goal is to have enough assets for retirement.
In general, a ratio of 50 per cent or more is healthy.
ALSO READ: How much do you really need to buy your first condominium in Singapore?
This article was first published in seedly.